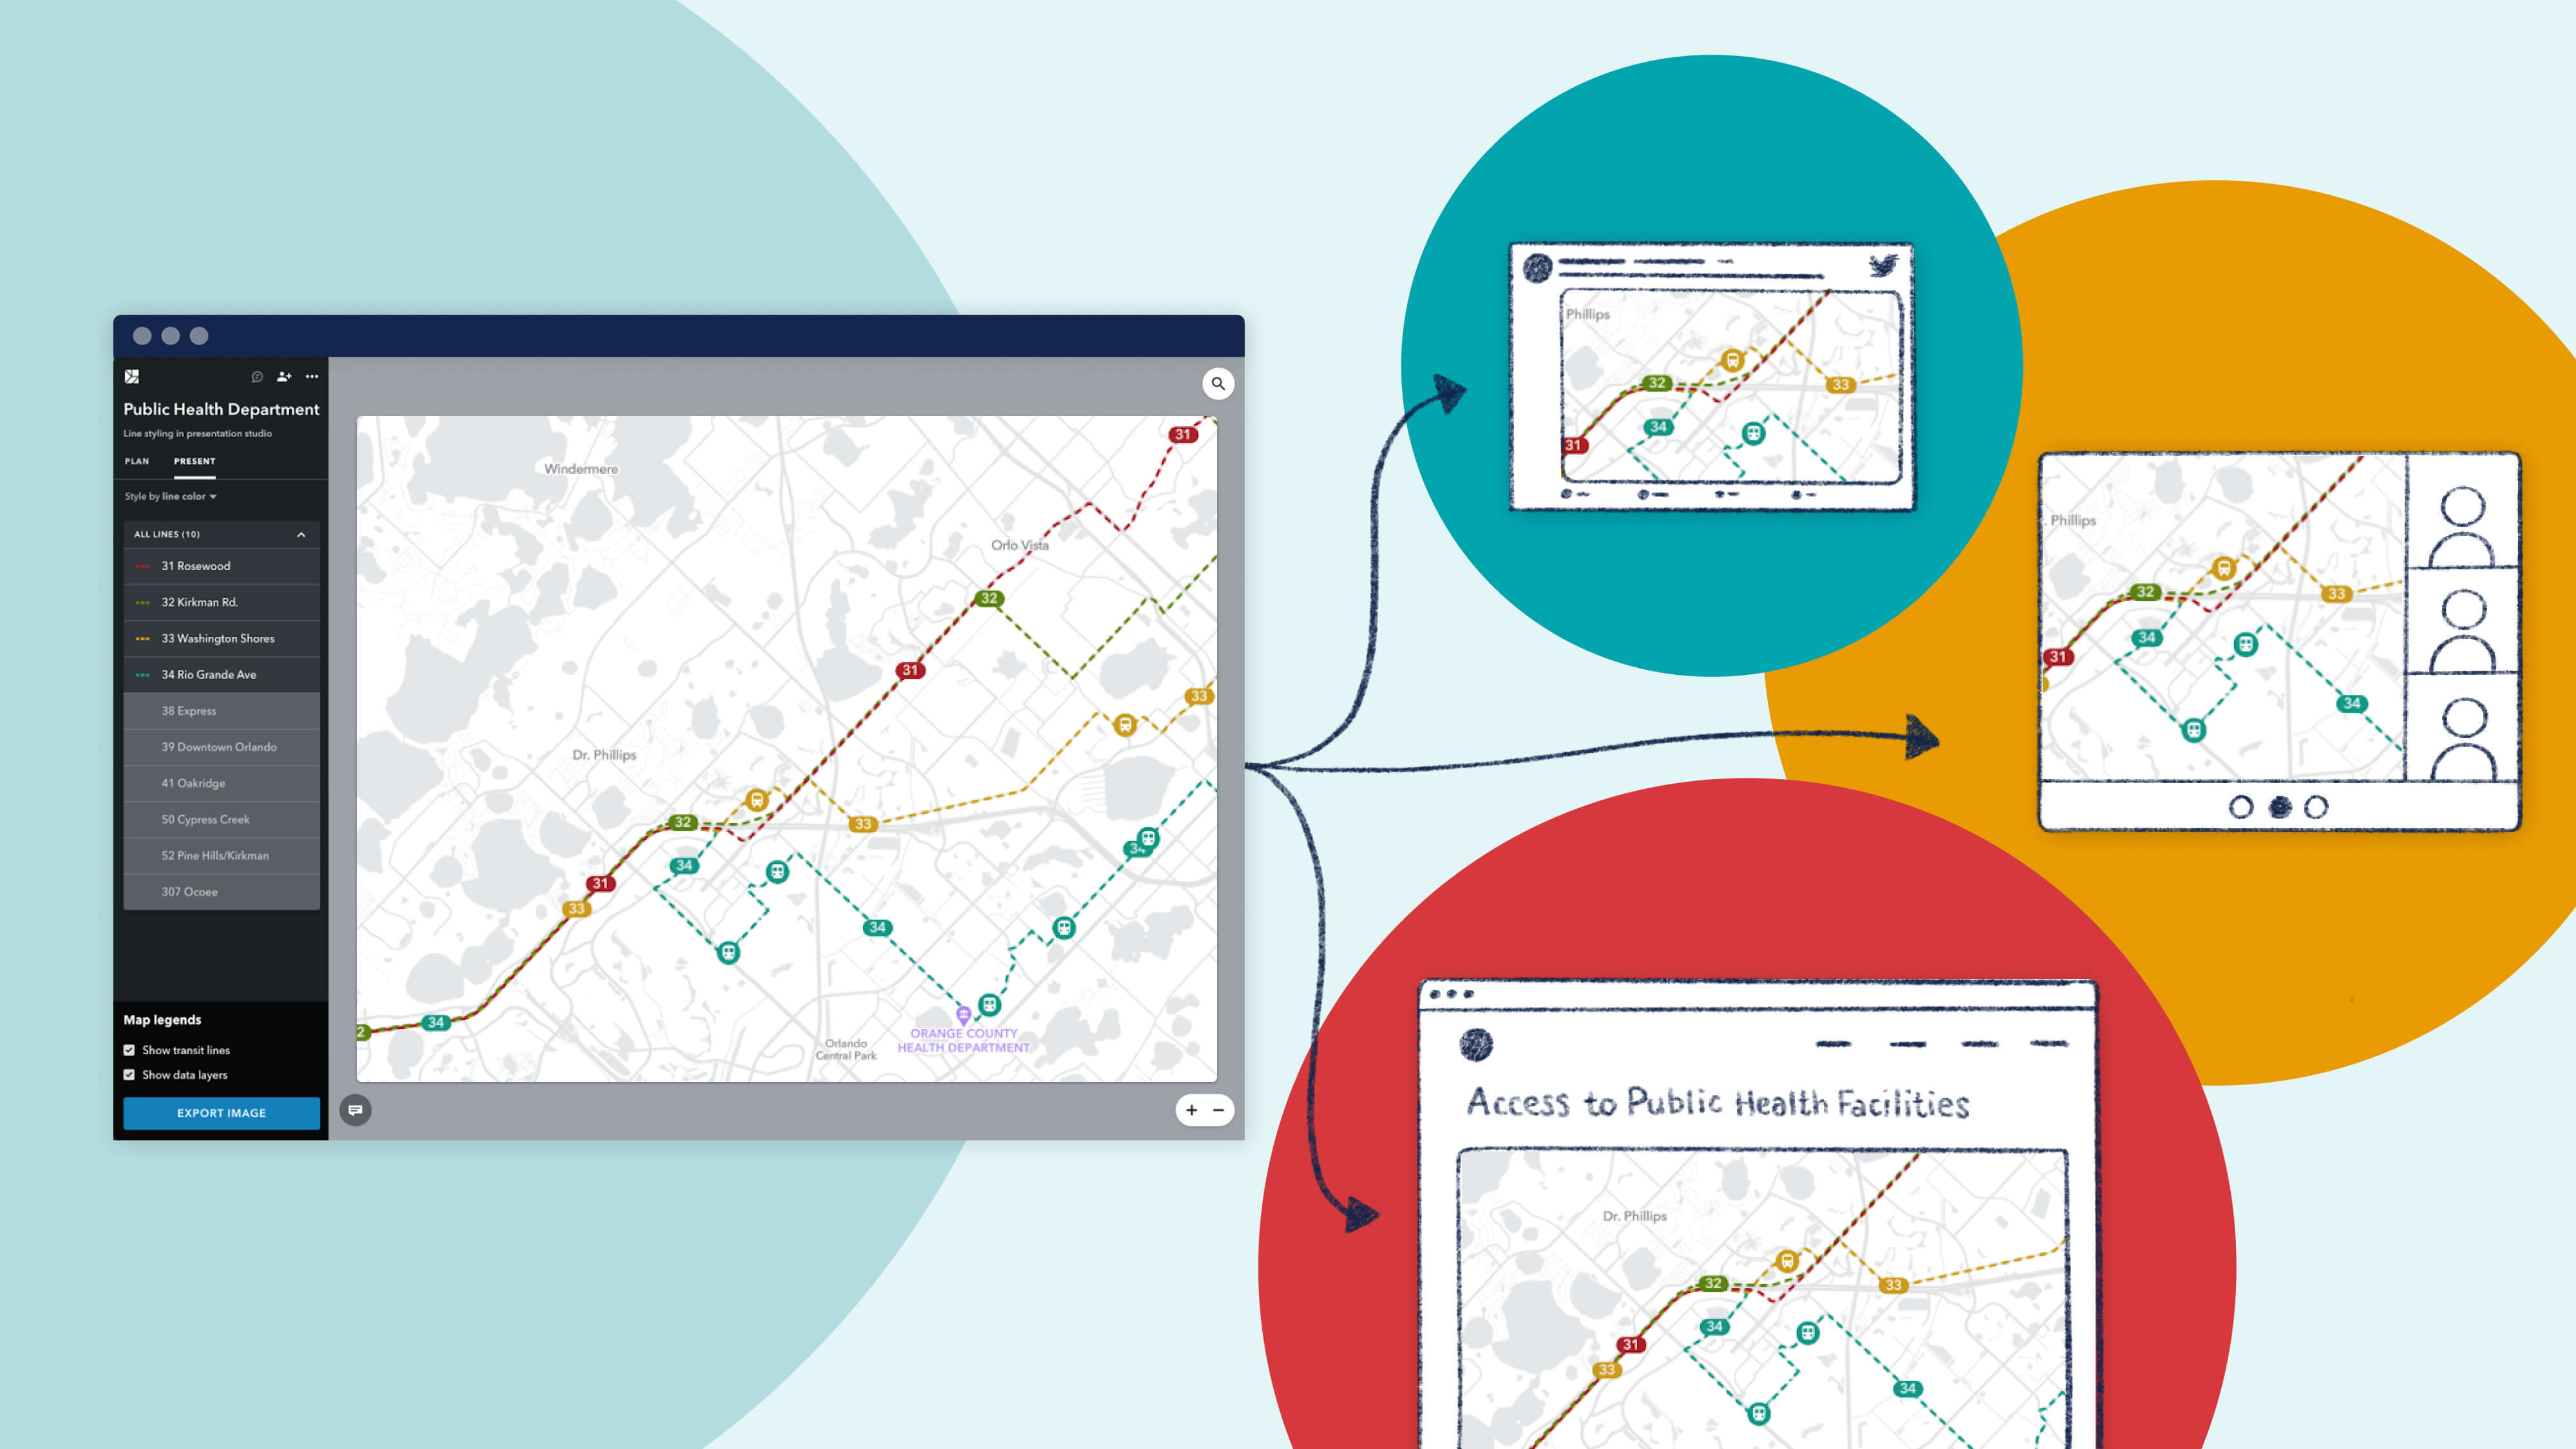
Delivering information to passengers is a critical element of public outreach for transit agencies. That’s why, last August, we launched Presentation Studio to empower agencies to turn their transit projects into public-facing materials with additional polish and high resolution visuals. Since then, we’ve increased the capabilities of Presentation Studio to include Remix Data Layers, text annotation, route codes, and customizable bus stops for added context and richness in visual storytelling.
Since the launch of Presentation Studio and our continued investment in the feature, we’ve been delighted to see the creative ways in which our partner agencies are using it: from communicating detours to riders, to telling a data-driven story, to collaborating with regional transit agencies, and more. Here are a few examples from our partner agencies.
Agencies like New York MTA and Go-RTS (Gainesville, FL) use Presentation Studio to communicate detours to both riders and drivers alike.
.jpg)
Agencies like SamTrans (San Mateo, CA) use Presentation Studio along with Remix’s text annotations to collaborate with other regional transit agencies. Transportation plans are complex, making them difficult to explain and contextualize with just an email or phone call. Remix maps provide all the visual context so that stakeholders in other agencies understand your proposals clearly.
The Jule (Dubuque, IA) uses Remix to ensure that information from other departments (like the Pavements Team with the Department of Public Works) doesn’t get lost.
.jpg)
Agencies from Calama, Chile to Bowling Green, Kentucky want to provide additional context to transit maps, like ridership details or commute modes. Overlaying Remix’s Data Layers with the network provides a richer story when seeking buy-in from executive leadership, board members, or even members of the community.
.jpg)
Presentation Studio offers enormous levels of customization for your exports so that you can communicate complex ideas with ease. To learn how to untap the full potential of Presentation Studio for your agency, reach out to your Partner Success Manager. If you’re new to Remix and would love to see your system and data in Presentation Studio, reach out here.

Introducing On-demand Planning: The first planning product for on-demand and flexible fleets that is data-driven, integrated with the fixed-route network, and collaborative.

Meet New Remix, designed to be more intuitive, flexible, and more powerfully multimodal.
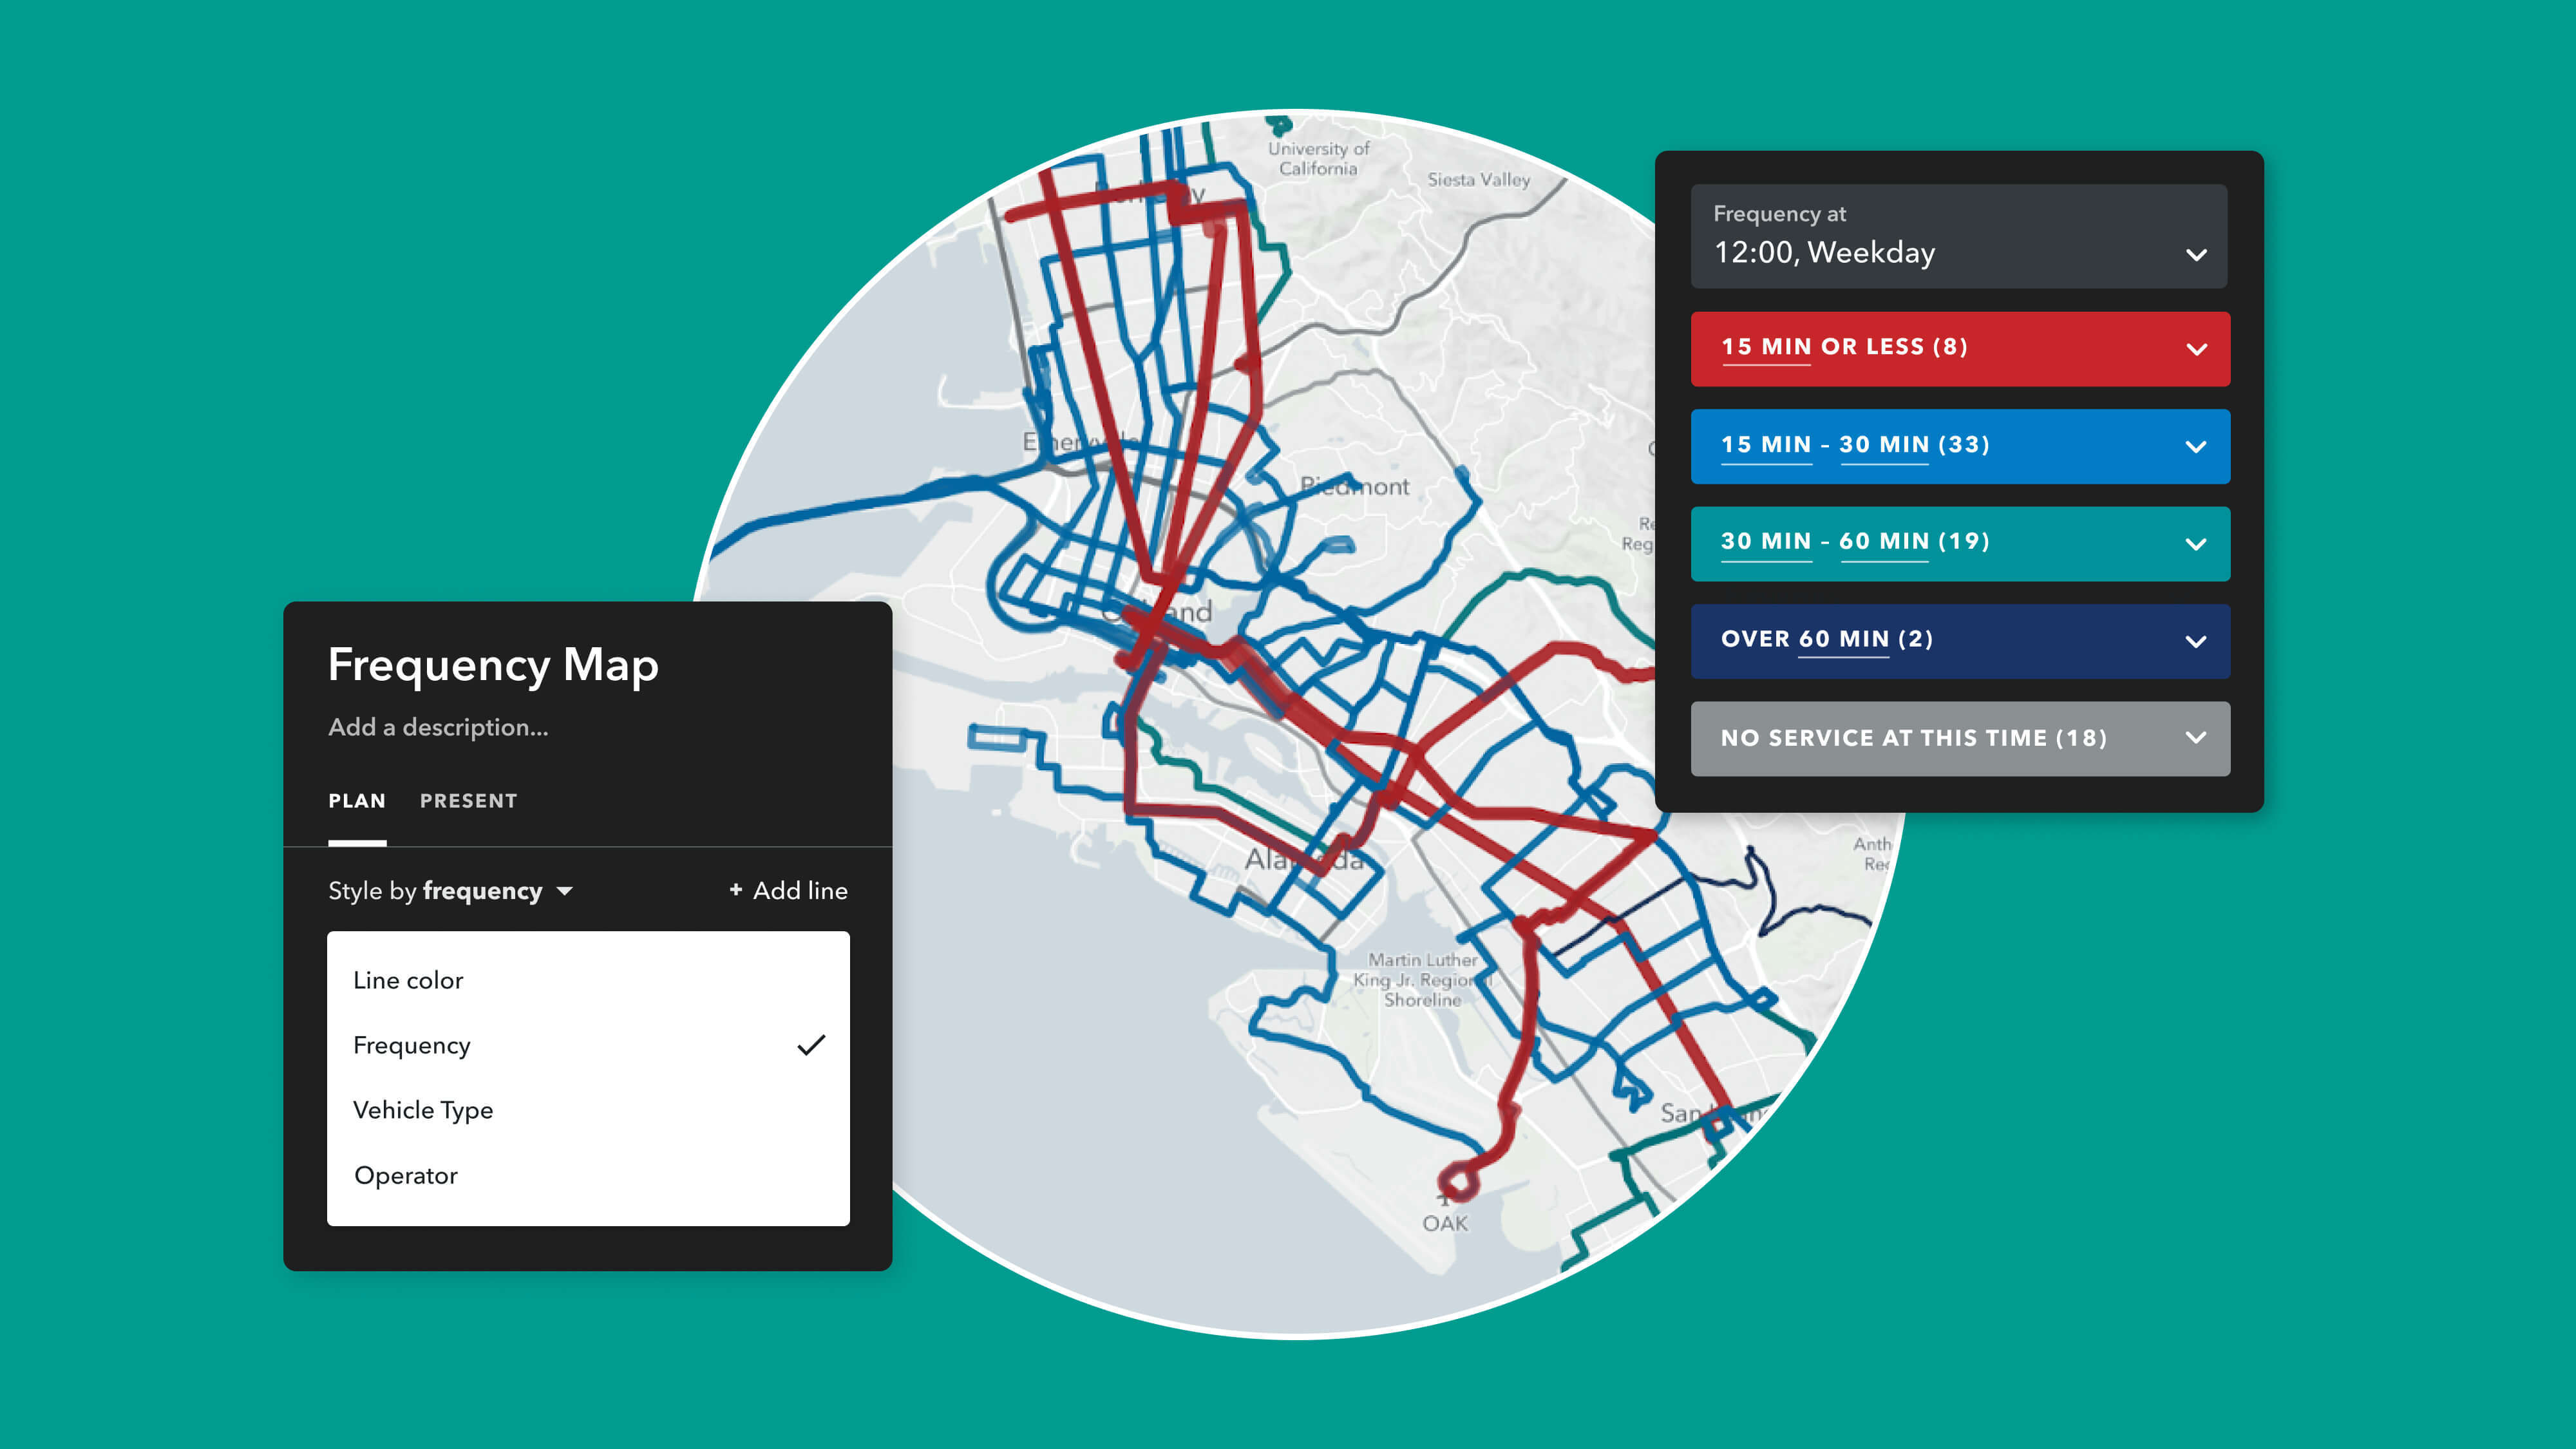
Delivering information about the quality of transit service is essential to public outreach.

